All companies use statistics to obtain the information.
Sampling
The responses which are gathered from the events or surveys are called data. To make the data meaningful, the company organizes it and discovers the certain patterns.
- Decide on a sample
- Choose a sampling method
- Collect the data from the sample
- Organize and interpret the data
- From the data, the company makes decisions.
For example, suppose there is a company in which each employee is either permanent or temporary.
| Permanent Employee | Temporary Employee | |
| Male | 90 | 81 |
| Female | 120 | 69 |
Now a company wants a random sample of 50 for some survey, how many from each group should you ask?
There are 360 employees in all.
Number of permanent male employee = (90 / 360) * 50 = 12.5
Number of permanent female employee = (120 / 360) * 50 = 16.67
Number of temporary male employee = (81 / 360) * 50 = 11.25
Number of temporary female employee = (69 / 360) * 50 = 9.58
But the number of employee can’t be fraction so we apply the simple rule:
- if fraction <= 0.5 then it will add 0
- if fraction > 0.5 then it will add 1
By this method,
Number of permanent male employee = (90 / 360) * 50 = 12
Number of permanent female employee = 17
Number of temporary male employee = 11
Number of temporary female employee = 10
A sample of 50 employee should includes 12 permanent male employees, 17 permanent female employees, 11 temporary male employees and 10 temporary female employees, selected at random.
The Mean, The Median And The Mode
Mean: The mean is the arithmetical average. It is the sum of all values divided by the number of values in the set.
Median: The median is the middle value when the values are arranged in order. If there is an even number of values, the median is the average of the two middle values.
Mode: The mode is the value that occurs most often. There may be more than one mode or no mode at all.
The following are the evening temperature in Mumbai during the month of April.
31°C, 24°C ,32°C, 24°C, 33°C, 24°C, 32°C, 24°C, 32°C, 25°C, 32°C, 25°C, 25°C, 22°C, 25°C, 22°C, 27°C, 22°C, 28°C, 22°C, 29°C, 22°C, 29°C, 23°C, 29°C, 24°C, 29°C, 24°C, 29°C, 23°C
Find the mean, the median and the mode temperatures.
When sorted temperatures
[22, 22, 22, 22, 22, 23, 23, 24, 24, 24, 24, 24, 24, 25, 25, 25, 25, 27, 28, 29, 29, 29, 29, 29, 31, 32, 32, 32, 32, 33]
Sum of all temperatures = 792
Number of days = 30
Mean = 26.4°C
Median = (15th element + 16th element) / 2 = 25°C
Mode =24°C (As 24°C occurs maximum time – 6 times)
Graphs and Charts
You conduct a survey of the class of 31 students to determine the number of minutes it takes each student to get to school on a normal day.
20, 21, 34, 38, 40, 16, 41, 17, 17, 24, 42,
20, 16, 31, 30, 27, 28, 22, 39, 17, 23,
18, 19, 25, 27, 40, 32, 16, 21, 36, 41
20, 21, 34, 38, 40, 16, 41, 17, 17, 24, 42, 20, 16, 31, 30, 27, 28, 22, 39, 17, 23, 18, 19, 25, 27, 40, 32, 16, 21, 36, 41
Sorted: 16, 16, 16, 17, 17, 17, 18, 19, 20, 20, 21, 21, 22, 23, 24, 25, 27, 27, 28, 30, 31, 32, 34, 36, 38, 39, 40, 40, 41, 41, 42
Median : 25
Lower extreme = 16
Higher extreme = 42
Lower hinge : 19 (Median of 16 to 24)
Higher hinge = 36 (Median of 27 to 42)
To display this data on a box plot, first draw a number line that include each piece of data. Then mark the median on the number line.
Draw a rectangle between the hinges. Draw whiskers from the hinges to the highest and lowest values.
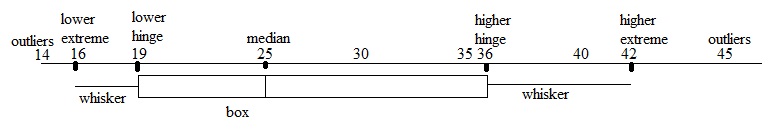
The median and the two hinges divide the data into four equal parts. Half the data is represented by the rectangle; the other half, by the whiskers.
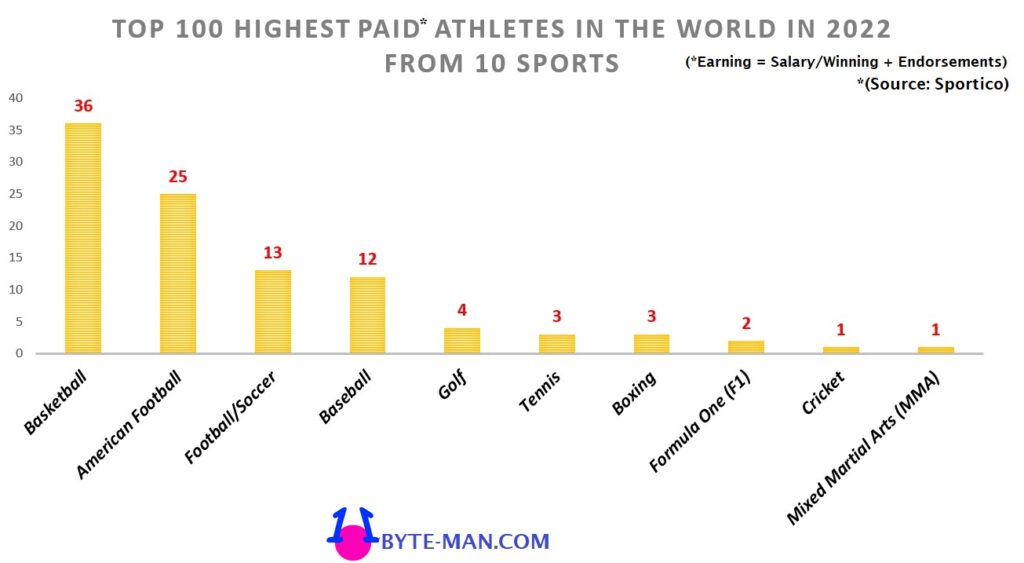
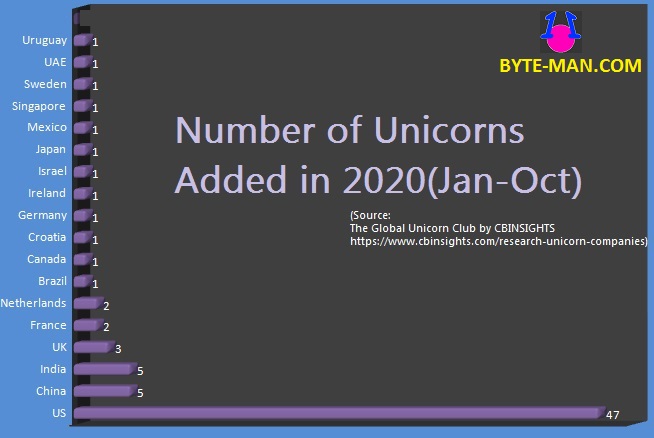
Bar Graph:
The bar graph is used to compare similar things.
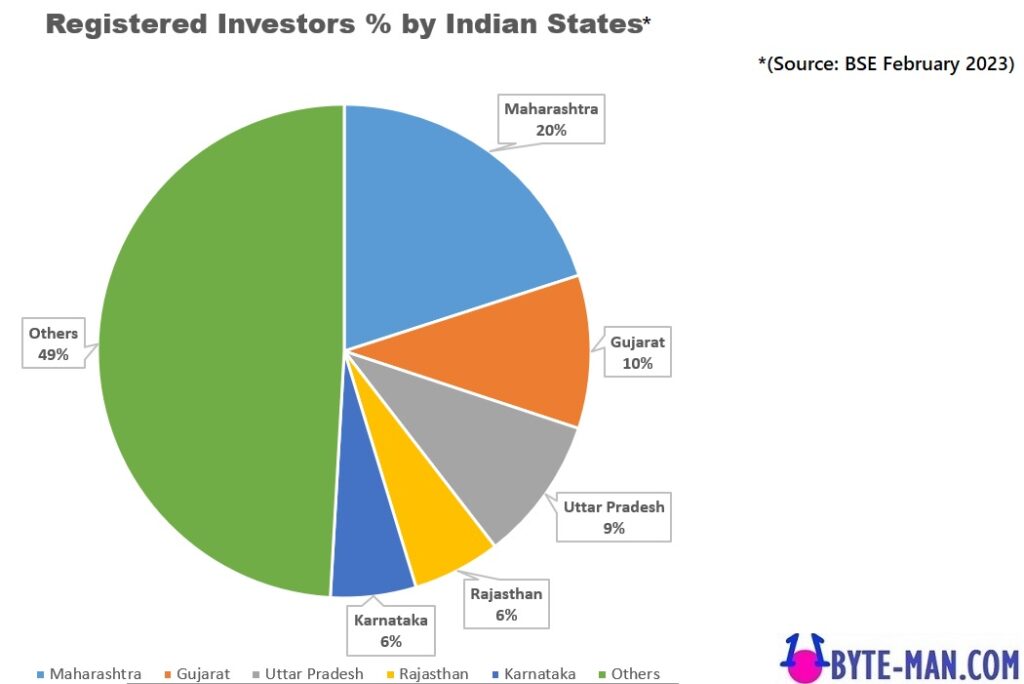
Pi Chart/ Circle Graph:
A pi chart is used to show how one thing is divided.